

Dashboards
Design dashboards in the browser, file them by role
Managers get the numbers they watch every day on one screen, designed in the browser by your own team.
Connect and insight
Standard Report Library
Warehouse and order reports run from the report menu with your own filters, and come back as a PDF or a spreadsheet file you can open in Excel. Pick a saved filter set to rerun a regular report with the same criteria.
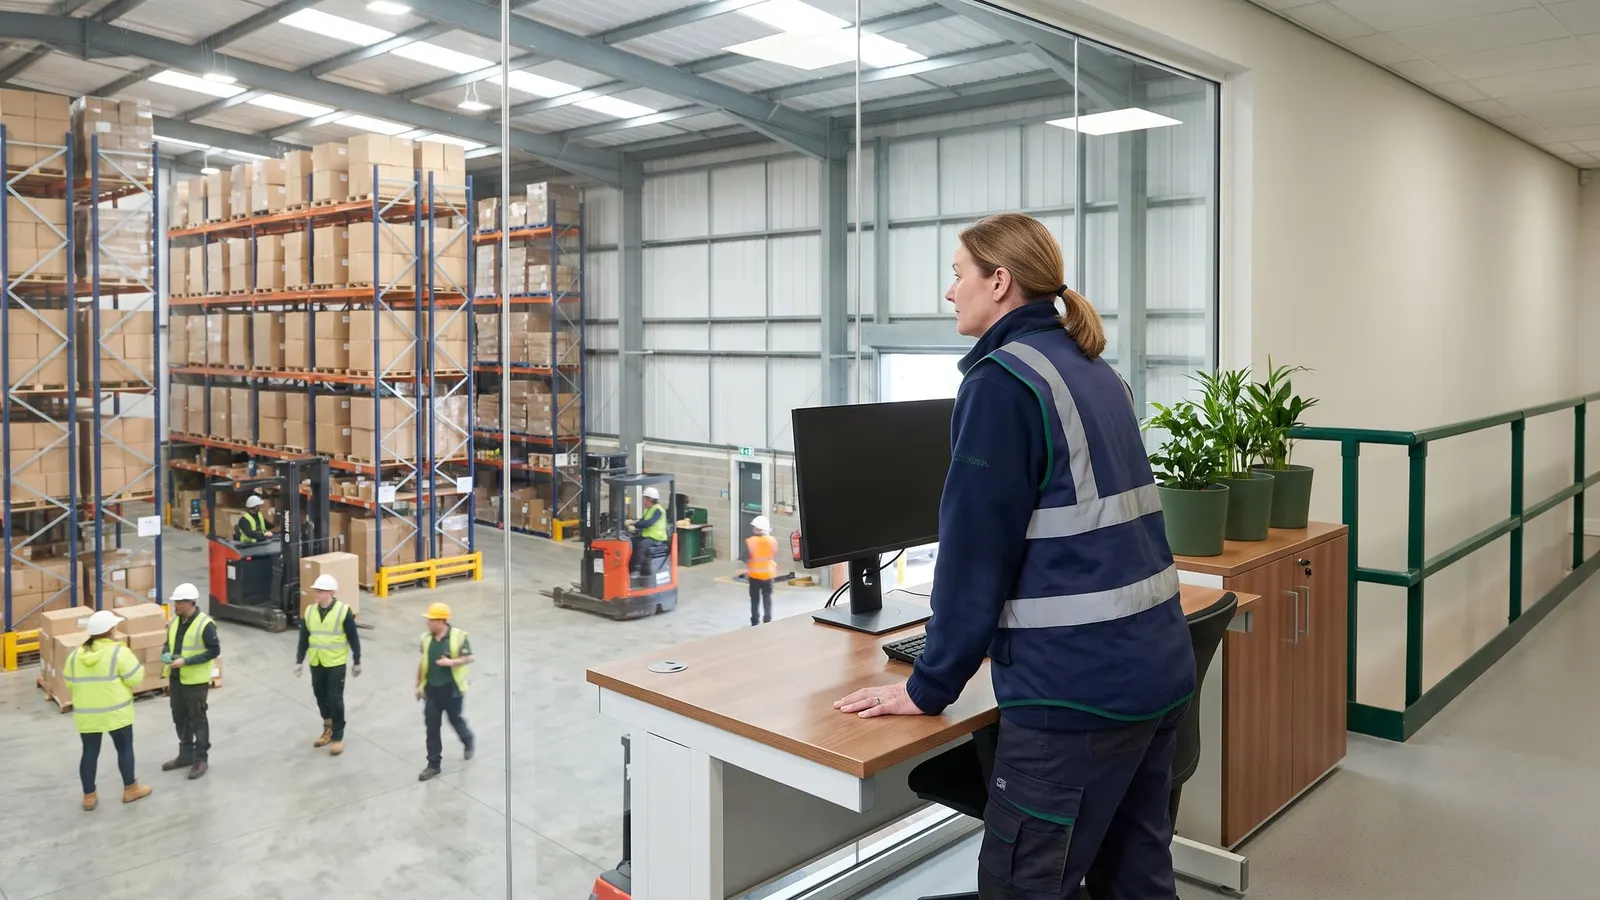
From customer quote to shipped order, for distributors.
Customers, their ship-to addresses and carriers are kept on one current record that every order starts from.
Each quote and order is priced from the customer's price level and your price tables, with discounts, fees and freight added on the order.
The warehouse counts stock from selection through reviewed variances to count adjustments.
Lots and warehouse locations are set on each order line, by hand or automatically, so pickers know what to pull.
Order and stock reports run with your own filters and come back as a PDF or a spreadsheet.
Straight answers, drawn from what the software does today.
Standard reports generate as PDF, XLS, XLSX or CSV files, filtered by the report's own fields and its subreports' fields.
Yes. Pick a saved filter set, called a macro, to rerun a report with the same criteria.
Yes. Your own custom report layouts run from the same report menu and can be placed on the menus of the modules and roles that use them.
Also in insight and ai.
Dashboards
Managers get the numbers they watch every day on one screen, designed in the browser by your own team.
Quick Query Dashboards
Your team saves the questions people ask every week as quick query dashboards.
Warehouse Reports
Run standard reports on what you hold, where it sits and what moved, from on-hand and availability by lot to location capacity, open orders and monthly activity.
Book a guided walkthrough with the Argos team.